

Updated 07/07/2021
Mobile and wearable devices are finding applications across many fields of medicine and epilepsy management is no exception. In recently published research, we tested whether the Seer app could be used to track people’s chance of having a seizure.
Our study showed that the Seer app can accurately tell if people have a low, moderate, or high chance of having a seizure, just by analysing their past seizure times. Just like Australia’s fire warning system, it is our hope that one day the Seer app can be used as a gauge of high and low-risk times for people with epilepsy.
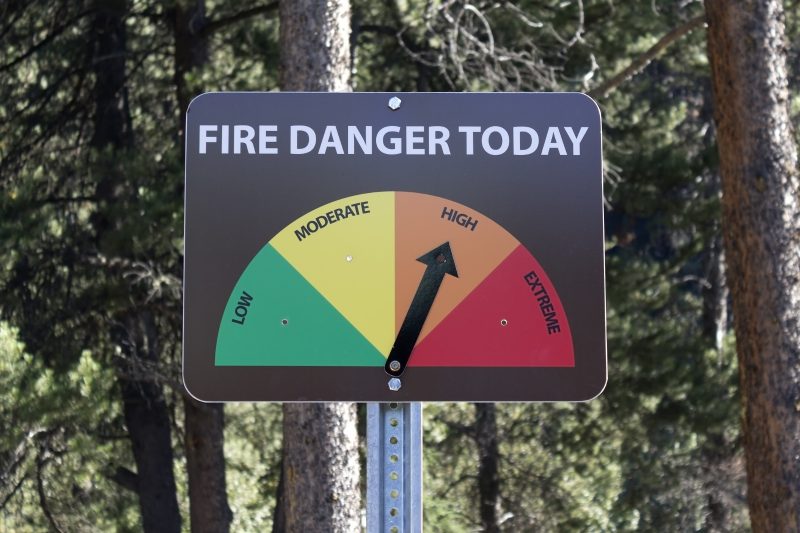
[Image description: Fire danger rating sign in the woods, indicating a ‘High’ chance of a fire today.]
Why forecast seizures?
For many people with epilepsy, the worst part of having seizures is that they happen with little or no warning. The uncertainty of seizures puts people in danger – even “small” seizures can result in serious injuries or death if they happen whilst driving, in the shower, cooking or pouring a kettle, climbing stairs or other everyday activities.
Unfortunately, this means people with epilepsy sometimes have to give up their driver’s license, modify or quit certain hobbies, and they or their family may experience anxiety in their day-to-day lives.

[Image description: Illustration of a person on the ground, surrounded by circles displaying catastrophic situations, including spilt coffee, car crash, falling off a ladder, dropping baby.]
Around two-thirds of people with epilepsy can eliminate their seizures by taking medications, however, this still leaves approximately 30% of people (over 24 million around the world) living with unpredictable seizures. And lifelong medication is not a great solution for everyone. Anti-epileptic drug side effects include dizziness, confusion, nausea, memory loss and others. Some people are willing to put up with these side effects every day even though they may only have a couple of seizures a year.
If people had some warning of when their seizures were more likely, it could reduce their stress and improve safety.
Even though we can’t yet cure seizures, it can be extremely helpful to tell people when they will experience times of higher or lower risk. Just as you or I use a weather forecast to help plan our lives, a seizure forecast can help people with epilepsy manage their activities, optimise their treatment, and hopefully reduce anxiety. Developing a reliable seizure forecast, or ‘Seizure Gauge’ is a key goal of the epilepsy community.
Our ongoing research has established that apps and wearable devices can also play an important role in forecasting seizures. This is because seizures often show rhythmic patterns, or cycles, which we are able to incorporate into personalised forecasts.
What are seizure cycles?
Since the earliest documented cases of epilepsy, people have reported cyclic rhythms of their seizures. In ancient times, it was thought that the phases of the moon must influence seizure risk (in fact, this line of research still continues today). It was also common for women to report seizures that aligned with their monthly menstrual cycle. Today, many people continue to report cyclic effects on their seizures.
[Image description: White alarm clock on table.]
Our earlier research confirmed that seizure cycles are common for people with all types of epilepsy, both men and women. Over 80% of people have a daily cycle (where seizures are more common at certain hours of the day) and over 50% of people have a cycle of one week or longer (for example, seizures might be more common on a Monday, or at a certain time of month).

[Image description: Graph showing proportion of people with epilepsy who have seizure cycles. 86% at least one cycle, 74% more than one cycle, 82% 24-hour cycle, 21% 7-day cycle, 22% >3-week cycle. Men and women equally have cycles.]
Proportion of people with epilepsy who have seizure cycles. Pip Karoly
The cause of these cycles remains a mystery. There are many possibilities, including internal hormonal and metabolic factors, changes in behaviour (like sleep quality, stress levels or exercise) and even environmental causes like seasonal variations. It is likely that there are different causes for different people’s cycles.
It is also important to know that a seizure cycle can exist without a person noticing. There are lots of reasons for this. A major reason is that seizures can be infrequent. Just because someone has a 30-day cycle it doesn’t mean they will have a seizure every 30 days like clockwork. They could go for three or four months without a seizure. However, their risk may still be higher every 30 days.
Another reason is that lots of people have multiple, overlapping cycles. A combination of cycles can appear quite irregular, and we use specialised analytic techniques to extract the cyclic information.
The aim of our recent study was to measure these cycles of seizure risk and determine how reliable they are to monitor someone’s chance of having a seizure.
How can the Seer app measure cycles of seizure risk?
The Seer app is an epilepsy management app where users can record seizures, medication and other information, like mood and sleep quality.
In this study, we used people’s recorded seizure times to detect two possible cycles: a “fast cycle” and a “slow cycle.” The fast cycle represents a short cycle of one or two days, likely driven by circadian rhythms of the body (i.e. sleep). The slow cycle could be one week or longer. We combined these two cycles to develop a score of seizure likelihood – low, medium or high – that represented the risk of having a seizure in the next hour.
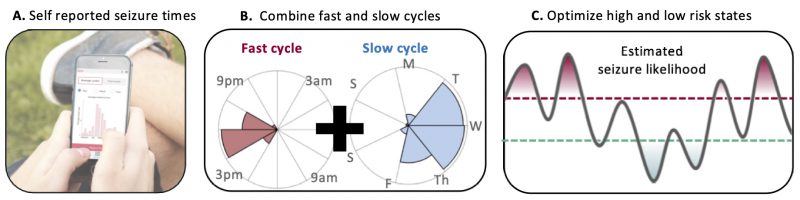
[Image description: Three boxes illustrating how the seizure forecast is measured: (A) a person is holding a phone that displays the Seer app, (B) two pie charts showing the fast cycle (time of day) and slow cycle (day of week) for seizures, (C) graph that combines fast and slow cycles to determine risk of seizure occurrence.]
Creating a seizure forecast. From Karoly et al (2020)
Download the Seer app to track events and contribute to ongoing seizure forecasting research.
We tested the seizure likelihood scores for 56 app users. Our test was hypothetical, meaning users did not actually see their forecast but we measured how it would have performed. This kind of testing is critical before trialling a true forecast with users. The average accuracy was 69.1%, meaning that, on average, 69.1% of seizures occurred during the high risk warning periods.
However, for some people, performance was much better, as high as 96%. On average, users spent 14.8% of their time with the high risk warning on, which is equivalent to 3.5 hours per day or about one day a week.
Users spent 67.1% of their time in low risk (16 hours a day or 4.5 days a week). On average, just under 10% of seizures occurred while users were in low-risk periods. So, for instance, if someone had 50 seizures, 5 would happen during the low risk time of their cycle, while the other 45 would occur during high or moderate risk times. In our study, there were 9 users who reported no seizures during the low-risk times.

Example of a hypothetical seizure forecast showing times of low risk (green), moderate risk (white) and high risk (red). The individual shown had an average of 2 seizures per week (shown as black triangles or red stars). Over one year, they spent about 10 weeks with a high risk score (18.7%) and almost 7 months with a low risk score (55.1%). They had 112 seizures, 67 occurred during high risk times and 10 occurred during low-risk times (35 seizures during moderate risk). From Karoly et al (2020)
We know that seizures can be triggered by many risk factors – a bad night’s sleep, missed medication, alcohol, or other changes in routine. Even when someone is at the low risk time of their cycle these triggers might still push their brain over the edge. We hope that collecting more information to measure additional risk factors will improve forecasting performance.
Next steps
The seizure times recorded in the Seer app provided useful information for a seizure risk gauge. However, forecasts are likely to become much more powerful with other sources of information.
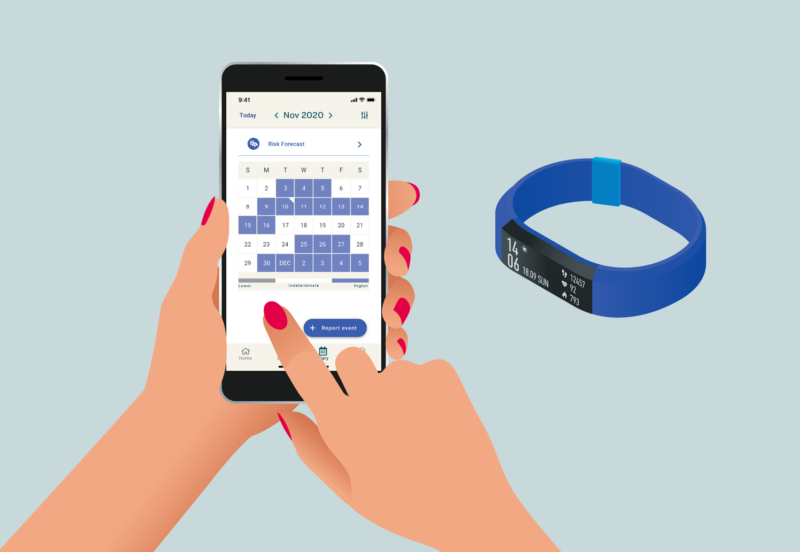
[Image description: Person using the Seer App on a phone. A blue Fitbit smartwatch is illustrated on the right.]
Our next research project is testing whether data from the Seer app and a Fitbit smartwatch can improve our ability to measure people’s seizure cycles and other risk factors. This new study is called ‘Tracking Seizure Cycles’ and we are currently enrolling participants. To participate in the study, email us at research@seermedical.com.
The Fitbit records activity (step count), heart rate, and sleep quality — all factors that may influence seizure risk.
Read more
To read the research publication in full see here.
If you or someone you know is experiencing seizures and you need help or information visit www.epilepsy.com.

[Image description: iPhone with the Seer app downloaded on right. Text on left reads “Keep track of your events. Have better conversations with your Doctor. Download the Seer app.”]